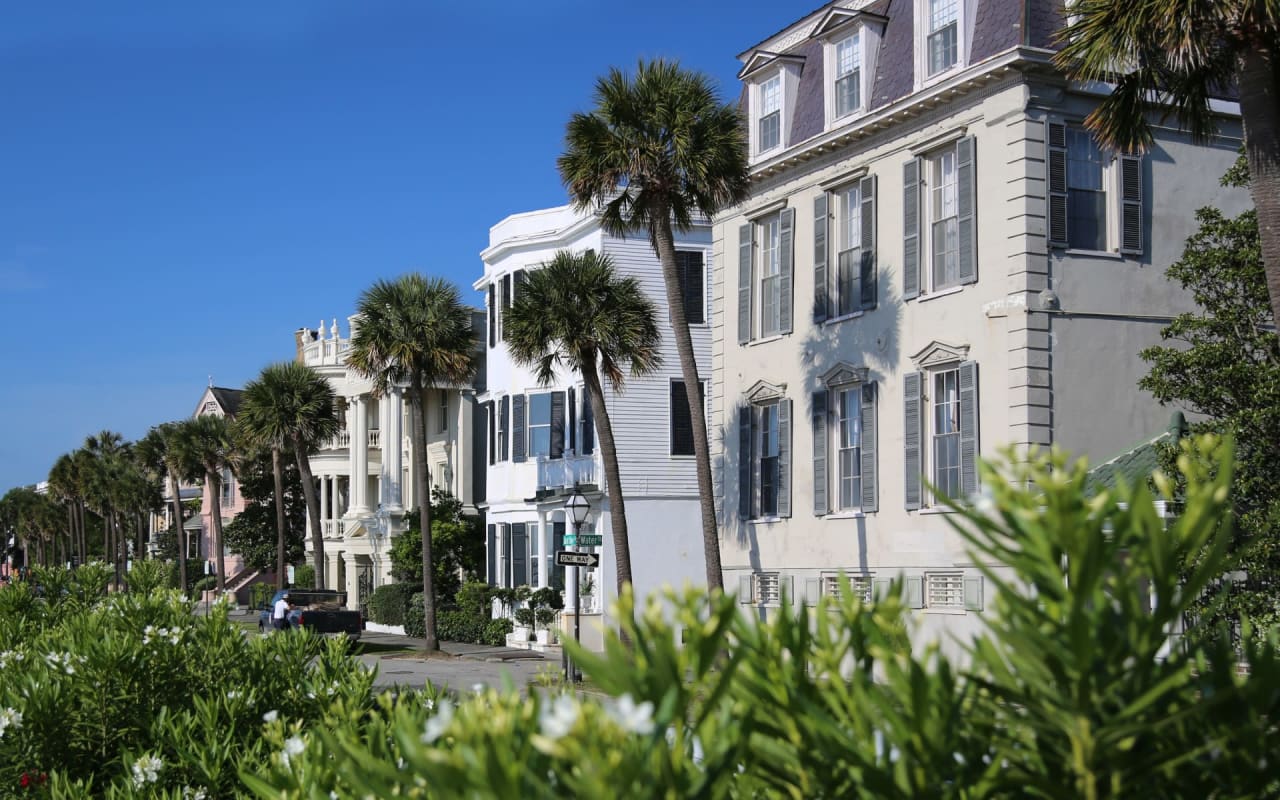
Here is just a snapshot of some of our hottest areas and once again August was on fire with home sales. We noticed a slight (short-lived) slow down prior to Labor Day which might be the ONLY normal thing about the Charleston market since pre-Covid.
NUMBER OF HOMES FOR SALE:
Entire MLS 2,106 | -48.1%
77 - Daniel Island 35 | -63.5%
42 - Mt Pleasant S of IOP Connector 88 | -65.2%
41 - Mt Pleasant N of IOP Connector 100 | -64.2%
DAYS ON MARKET:
Entire MLS 4 | -63.6%
77 - Daniel Island 1 | -96.2%
42 - Mt Pleasant S of IOP Connector 3 | -83.3%
41 - Mt Pleasant N of IOP Connector 3 | -87.0%
AVERAGE DAYS ON MARKET:
Entire MLS $357,900 | +13.6%
77 - Daniel Island $1,130,000 | +34.8%
42 - Mt Pleasant S of IOP Connector $589,000 | +14.4%
41 - Mt Pleasant N of IOP Connector $625,000 | +22.9%
DOLLAR VOLUME SOLD:
Entire MLS $1,024,308,765 | +12.9%
77 - Daniel Island $74,046,460 | +52.2%
42 - Mt Pleasant S of IOP Connector $90,502,899 | +12.0%
41 - Mt Pleasant N of IOP Connector $92,654,051 | -7.1%
AVERAGE PRICE PER SQUARE FOOT:
Entire MLS $185 | +13.5%
77 - Daniel Island $469 | +68.7%
42 - Mt Pleasant S of IOP Connector $302 | +23.3%
41 - Mt Pleasant N of IOP Connector $252 | +28.6%
Questions about the market? Curious about what the Real Estate picture looks like in your area? Is it the right time to buy or sell? Should you invest in Real Estate in the #1 City in the World (9 years running)? Give us a call, we would love to talk to you!
Happy September!
~ Tricia
phone: (843) 847-1762
email: [email protected]